Case Study.

Weather-Based Optimisation
Custom algorithme to boost photo books sales.
About the client :
CEWE is Europe’s leading photo and online print service. With 11 production sites and more than 3,000 employees across 24 European countries, the USA, Canada and Brazil, they’ve long been at the forefront of pioneering product innovations and technological developments in the digital world. Each year, they supply around 2.5 billion photos and 5.6 million photo books, working with more than 33,000 retailers across Europe.
Challenge :
Printing a photo book is not as straightforward as it may seem. You need to download the software, select photos, create the photo book and finally print it. The process can take up to 2 hours and requires you to be in front of your computer.
So when are people likely to spend 2 hours of their free time in front of their laptop? Wouldn’t a rainy day be a perfect opportunity? We proposed to test the hypothesis that weather has a significant impact on CEWE’s conversion rate through an experiment that makes the data speak for itself.
Objectives :
- Phase 1 : understand the relationship between weather and conversion rate. Are people more likely to print a photo book when it rains? If so, when? Does it differ from one city to another? From one day of the week to another?
- Phase 2 : implement a bid management algorithm based on phase 1. For instance, if people are more likely to print a photo book on rainy Mondays, we’ll dynamically raise the bids accordingly on Mondays when it rains in a specific region.
Our approach :

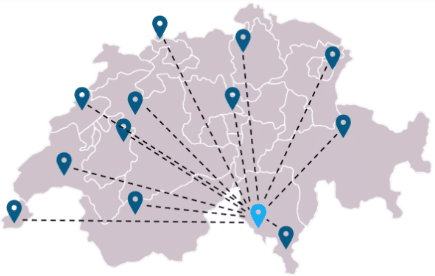
The data provided by Google’s is far more granular than the weather data. If we take the example of Switzerland, a country with only 12 weather stations, but in which Google’s targeting includes more than 600 cities, what data should be attributed to which city?
To address this issue, we mapped the geographical coordinates of Google weather stations and cities, and we measured the distance between each city and weather station, in order to isolate the nearest weather station to each city.
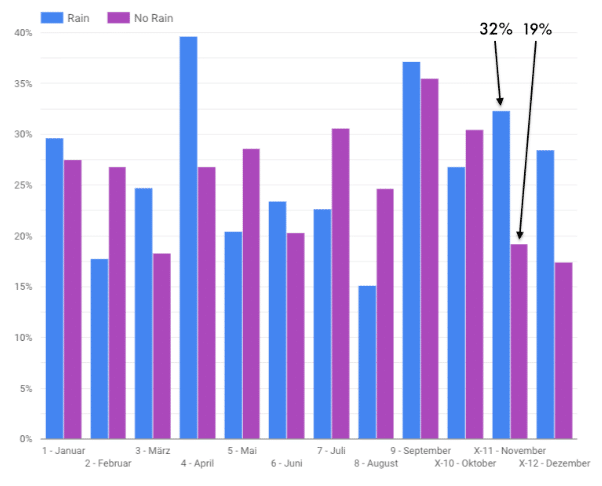
For our analysis, we used the conversion rate as an indicator. This metric is ideal because it allows to reduce everything to the same scale in order to compare performances across campaigns, months, and days of the week. We then ensured that our insights were statistically significant using Chi-Squared tests with a significant threshold of 5% (thus indicating a statistical significance of 95%).

Our analysis revealed that the impact of weather was consistently more important throughout certain months, and on particular days of the week. Based on these findings, we implemented a weather-based dynamic bidding adjustment algorithm at a city level, which takes into account the day of the week and the month of the year in order to determine the ideal adjustment.


